


- News Releases
- Community Impact
- Social Media
- Media Kit
News Releases
Community Impact
Educating the Next Generation: How Nucor is Sparking Interest in Steel
See how Nucor partnered with Discovery Education to provide students nationwide access to quality STEM and sustainability education about steel manufacturing.
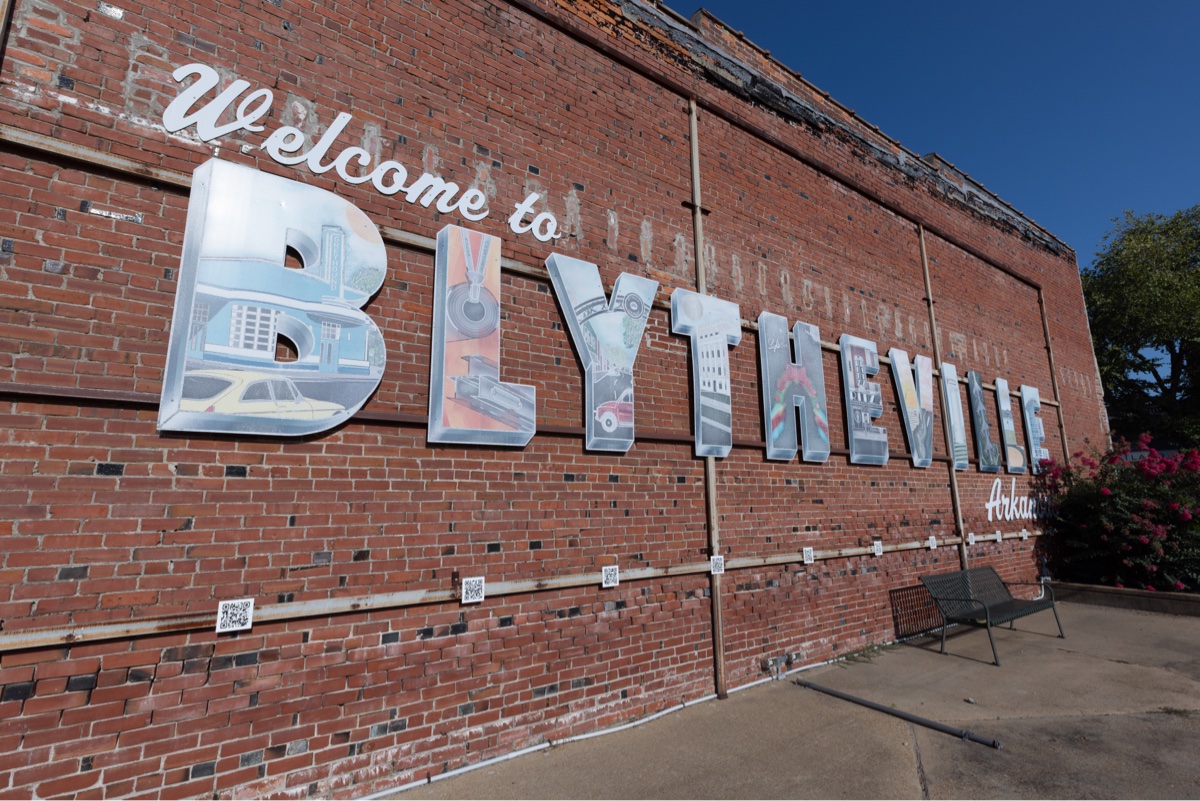
The Story of Steel In Arkansas
For nearly four decades, Nucor Steel Arkansas and Nucor-Yamato Steel have invested in this state – in its people, its schools, its communities. We’re not just part of the economy – we’re part of the story.
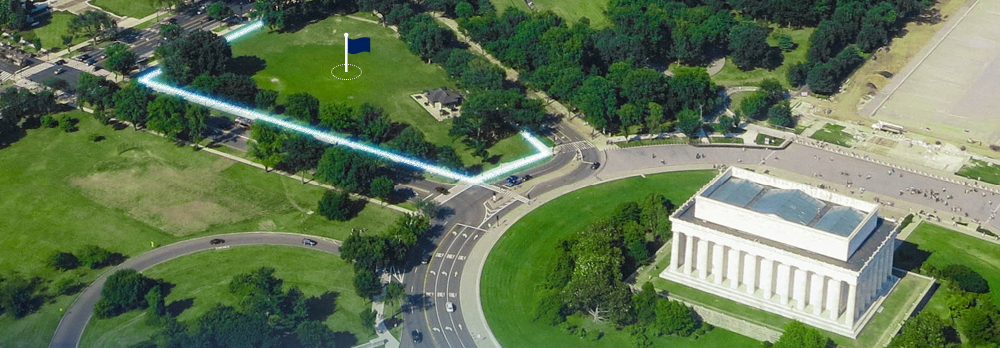
Nucor Announces Historic Donation for Global War on Terrorism Memorial
In October of 2023, Nucor and the Nucor Charitable Foundation proudly donated $2.5 million to the Global War on Terrorism Memorial Foundation.
Media Kit
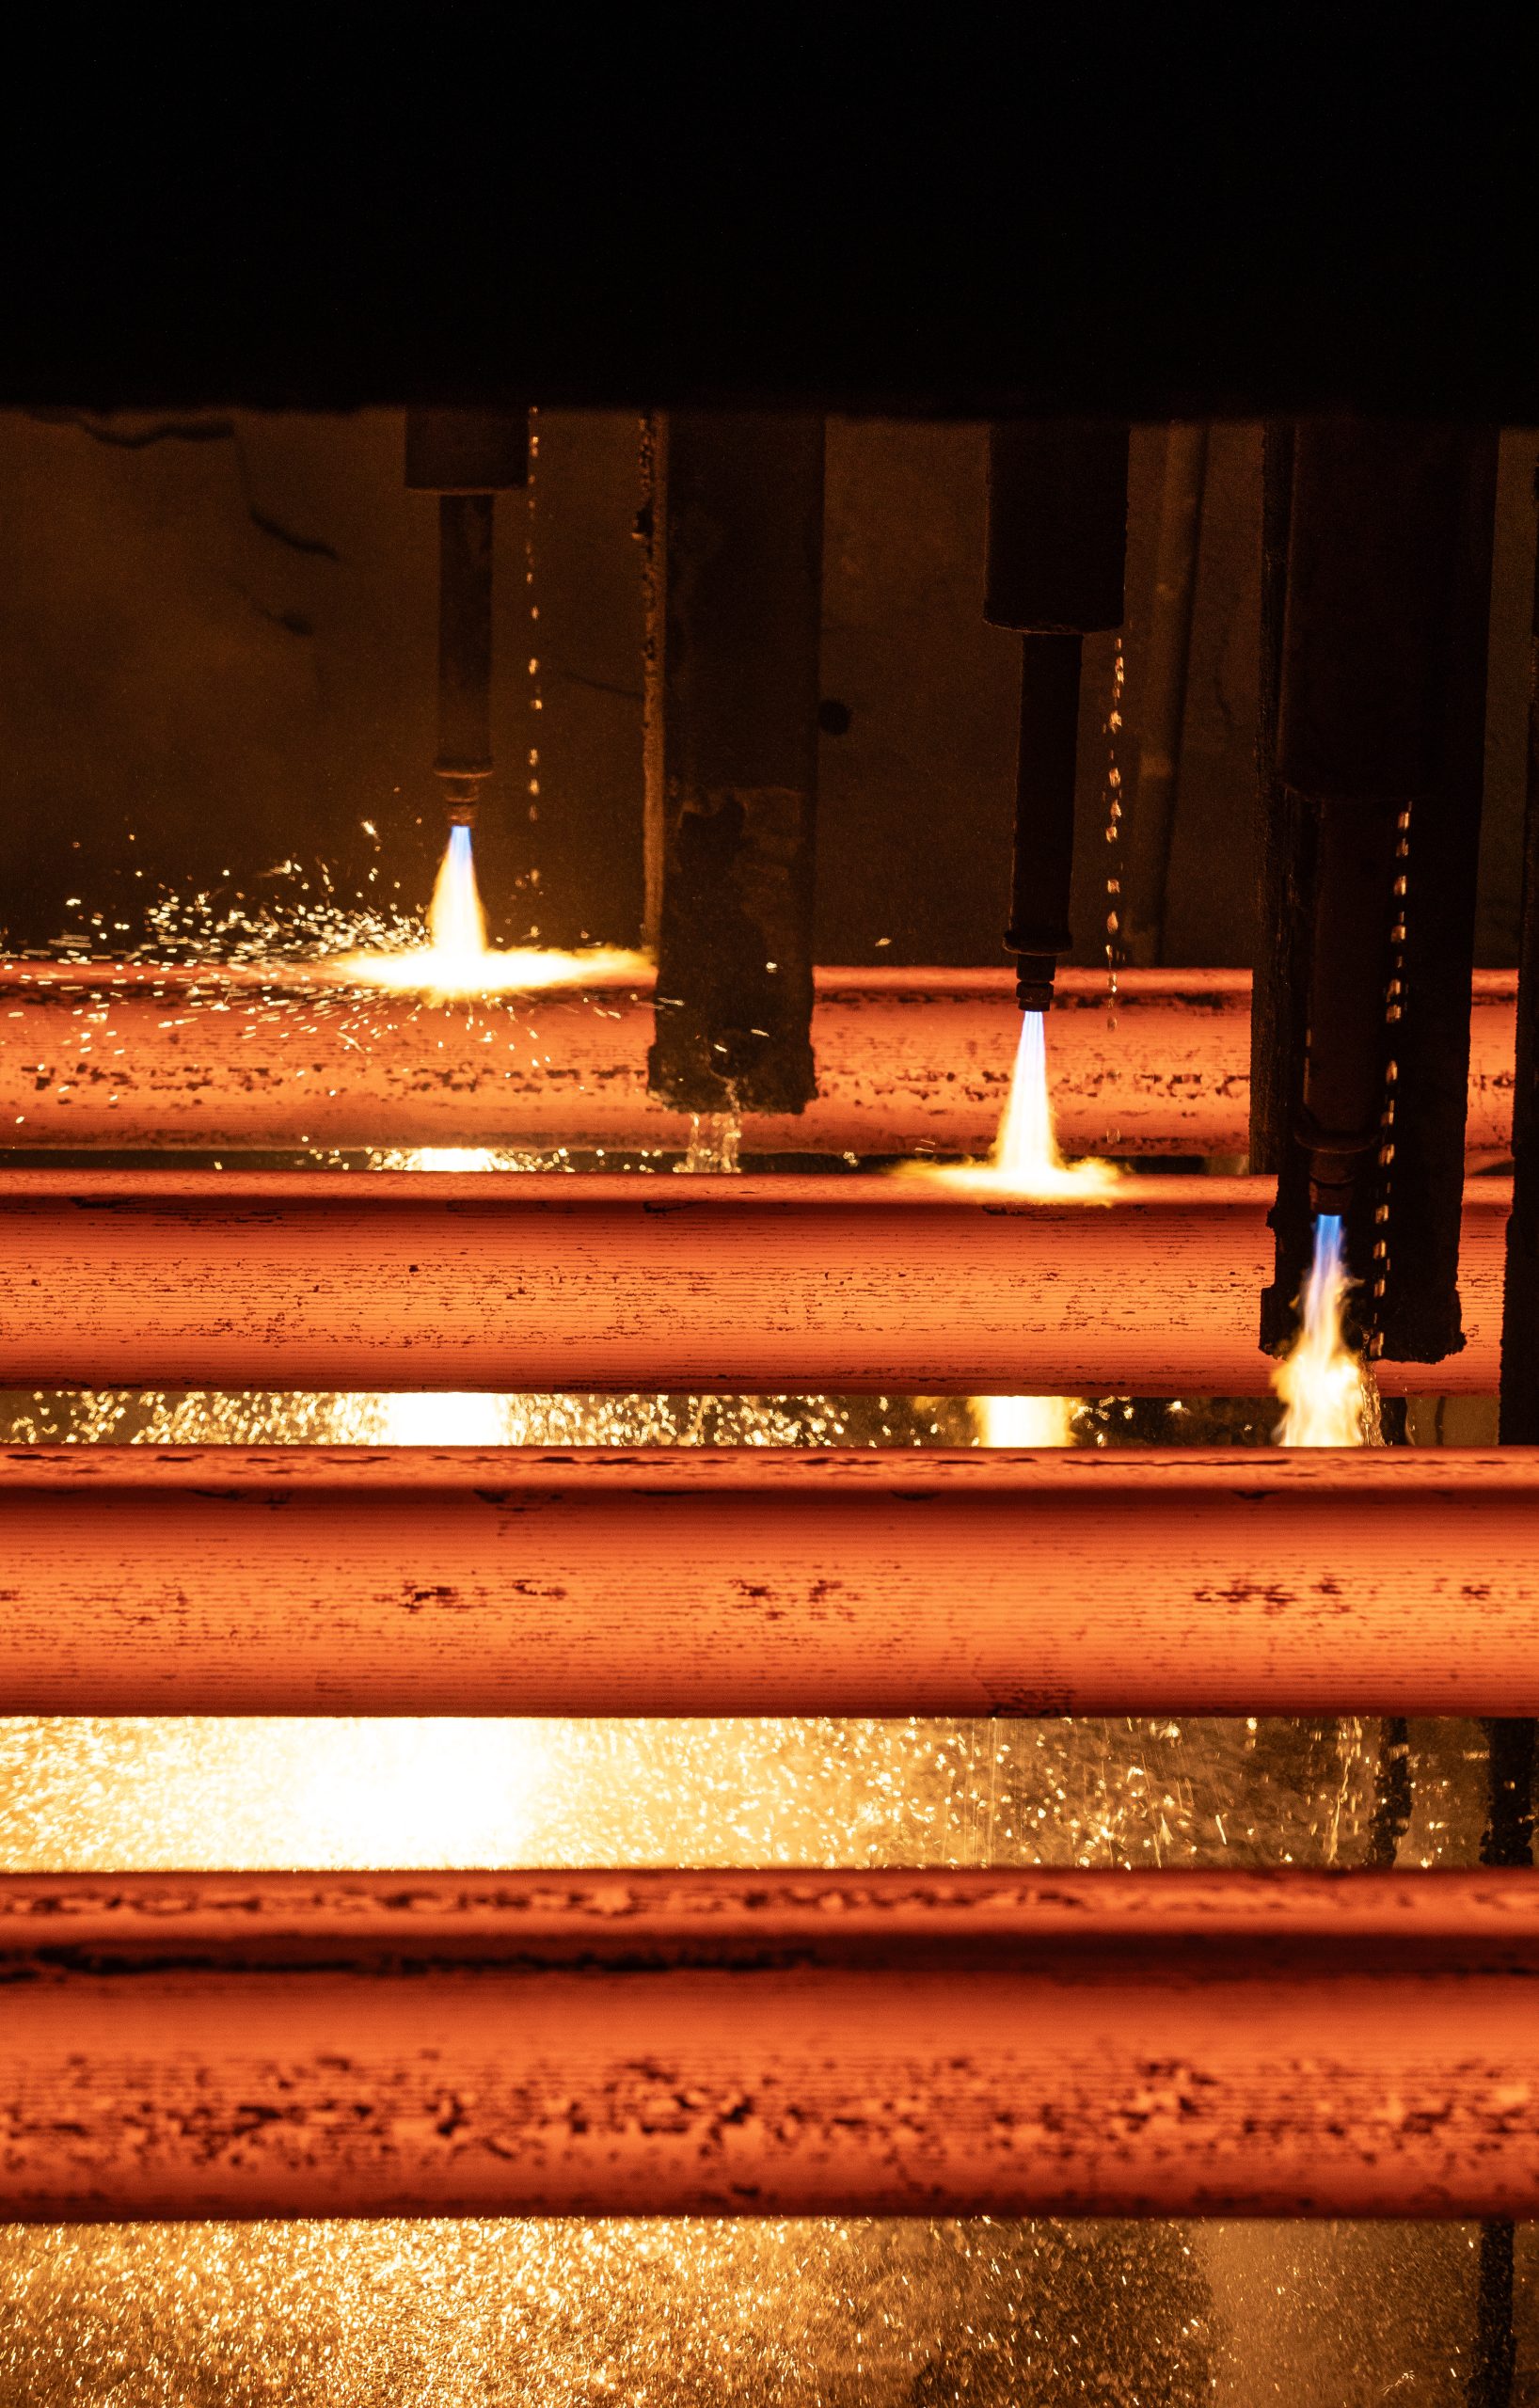
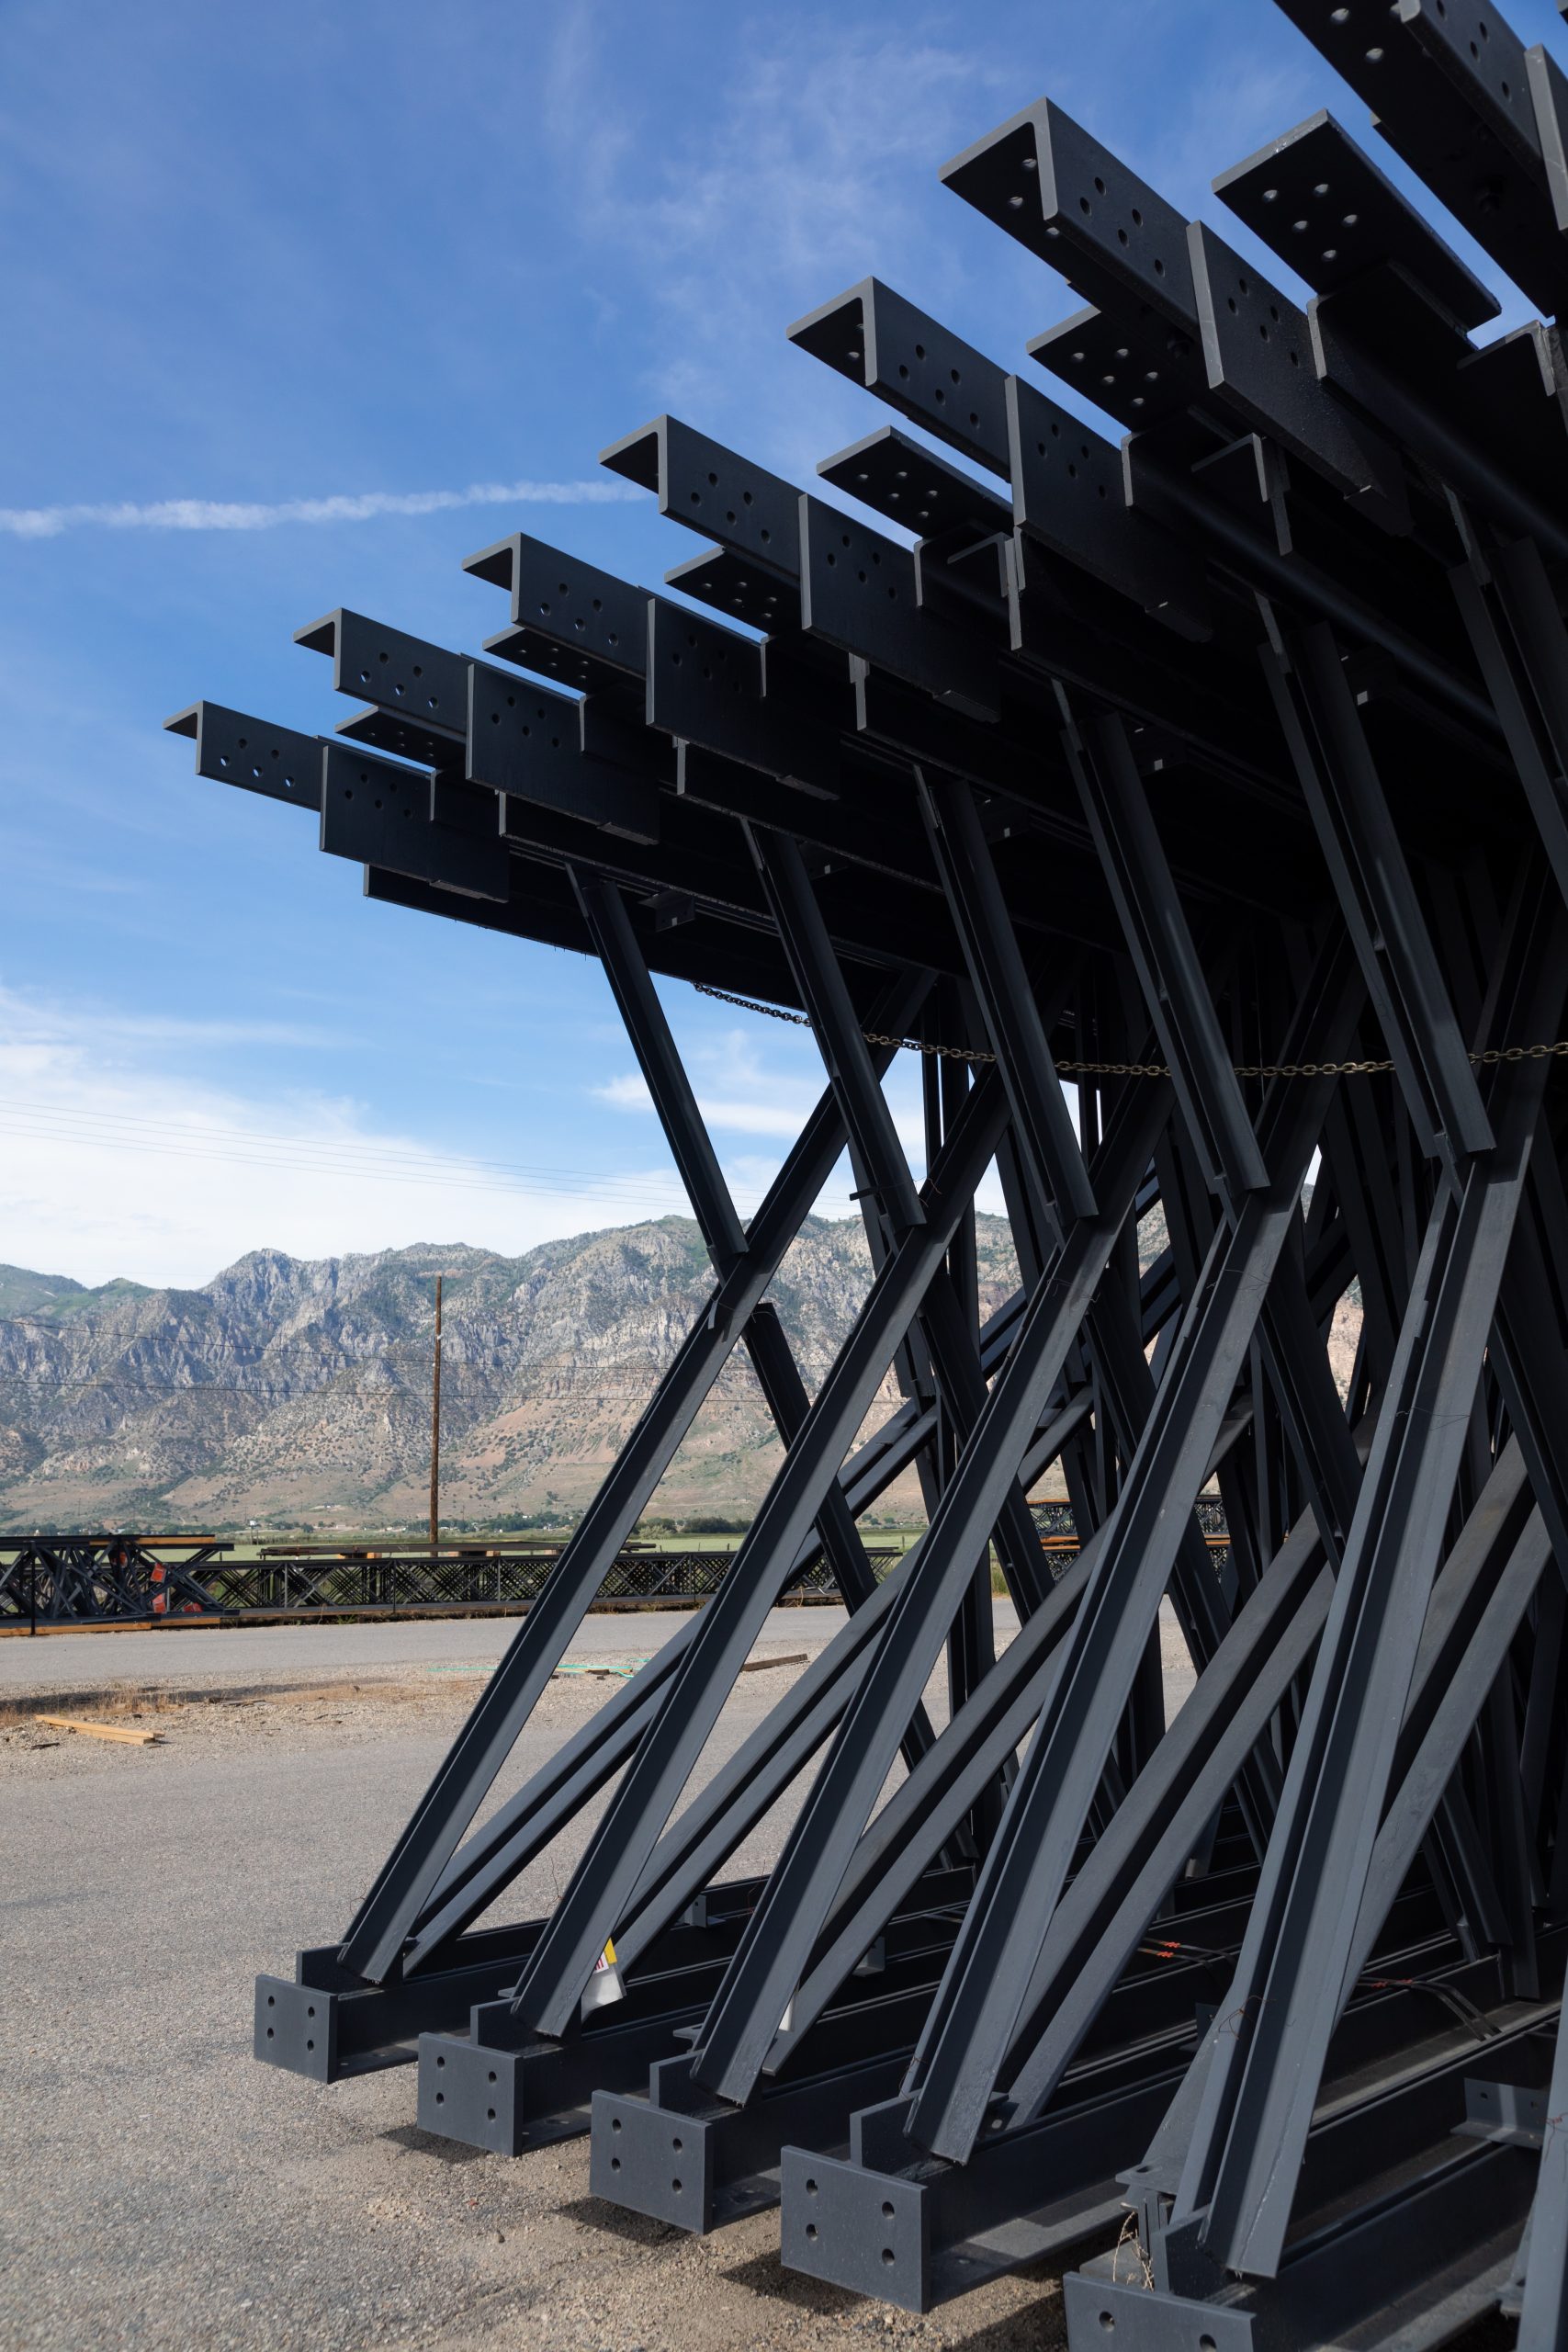

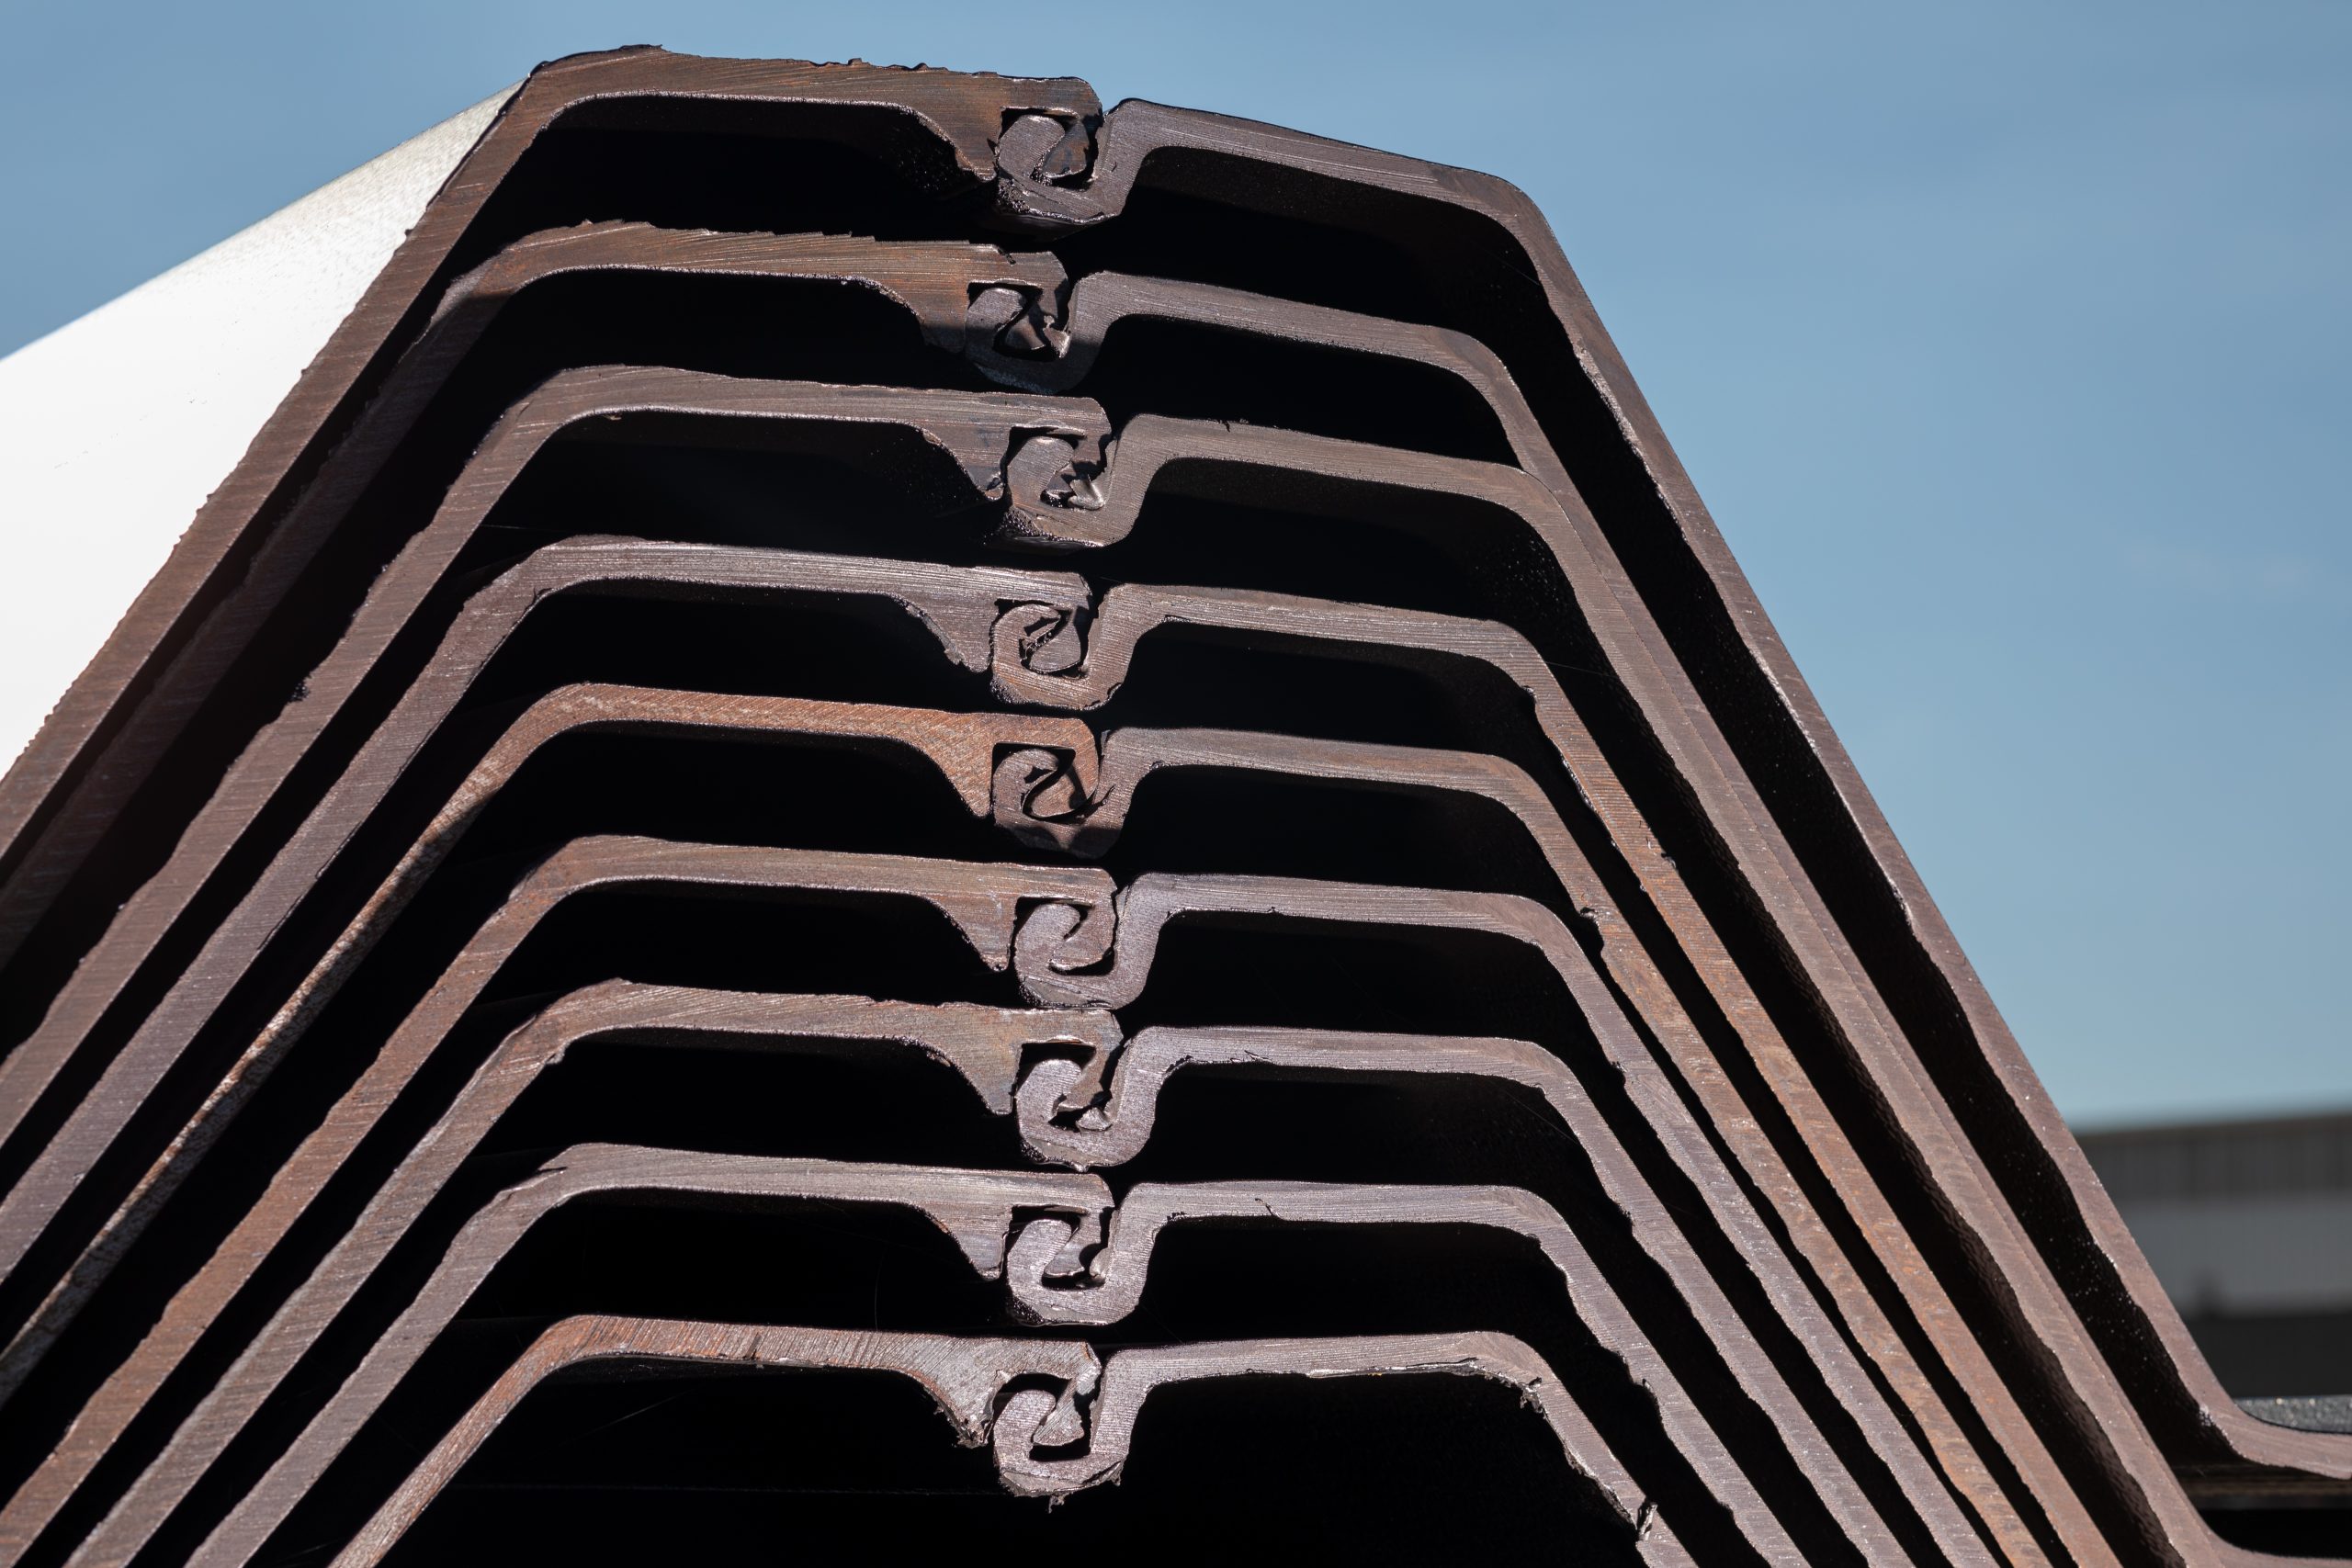
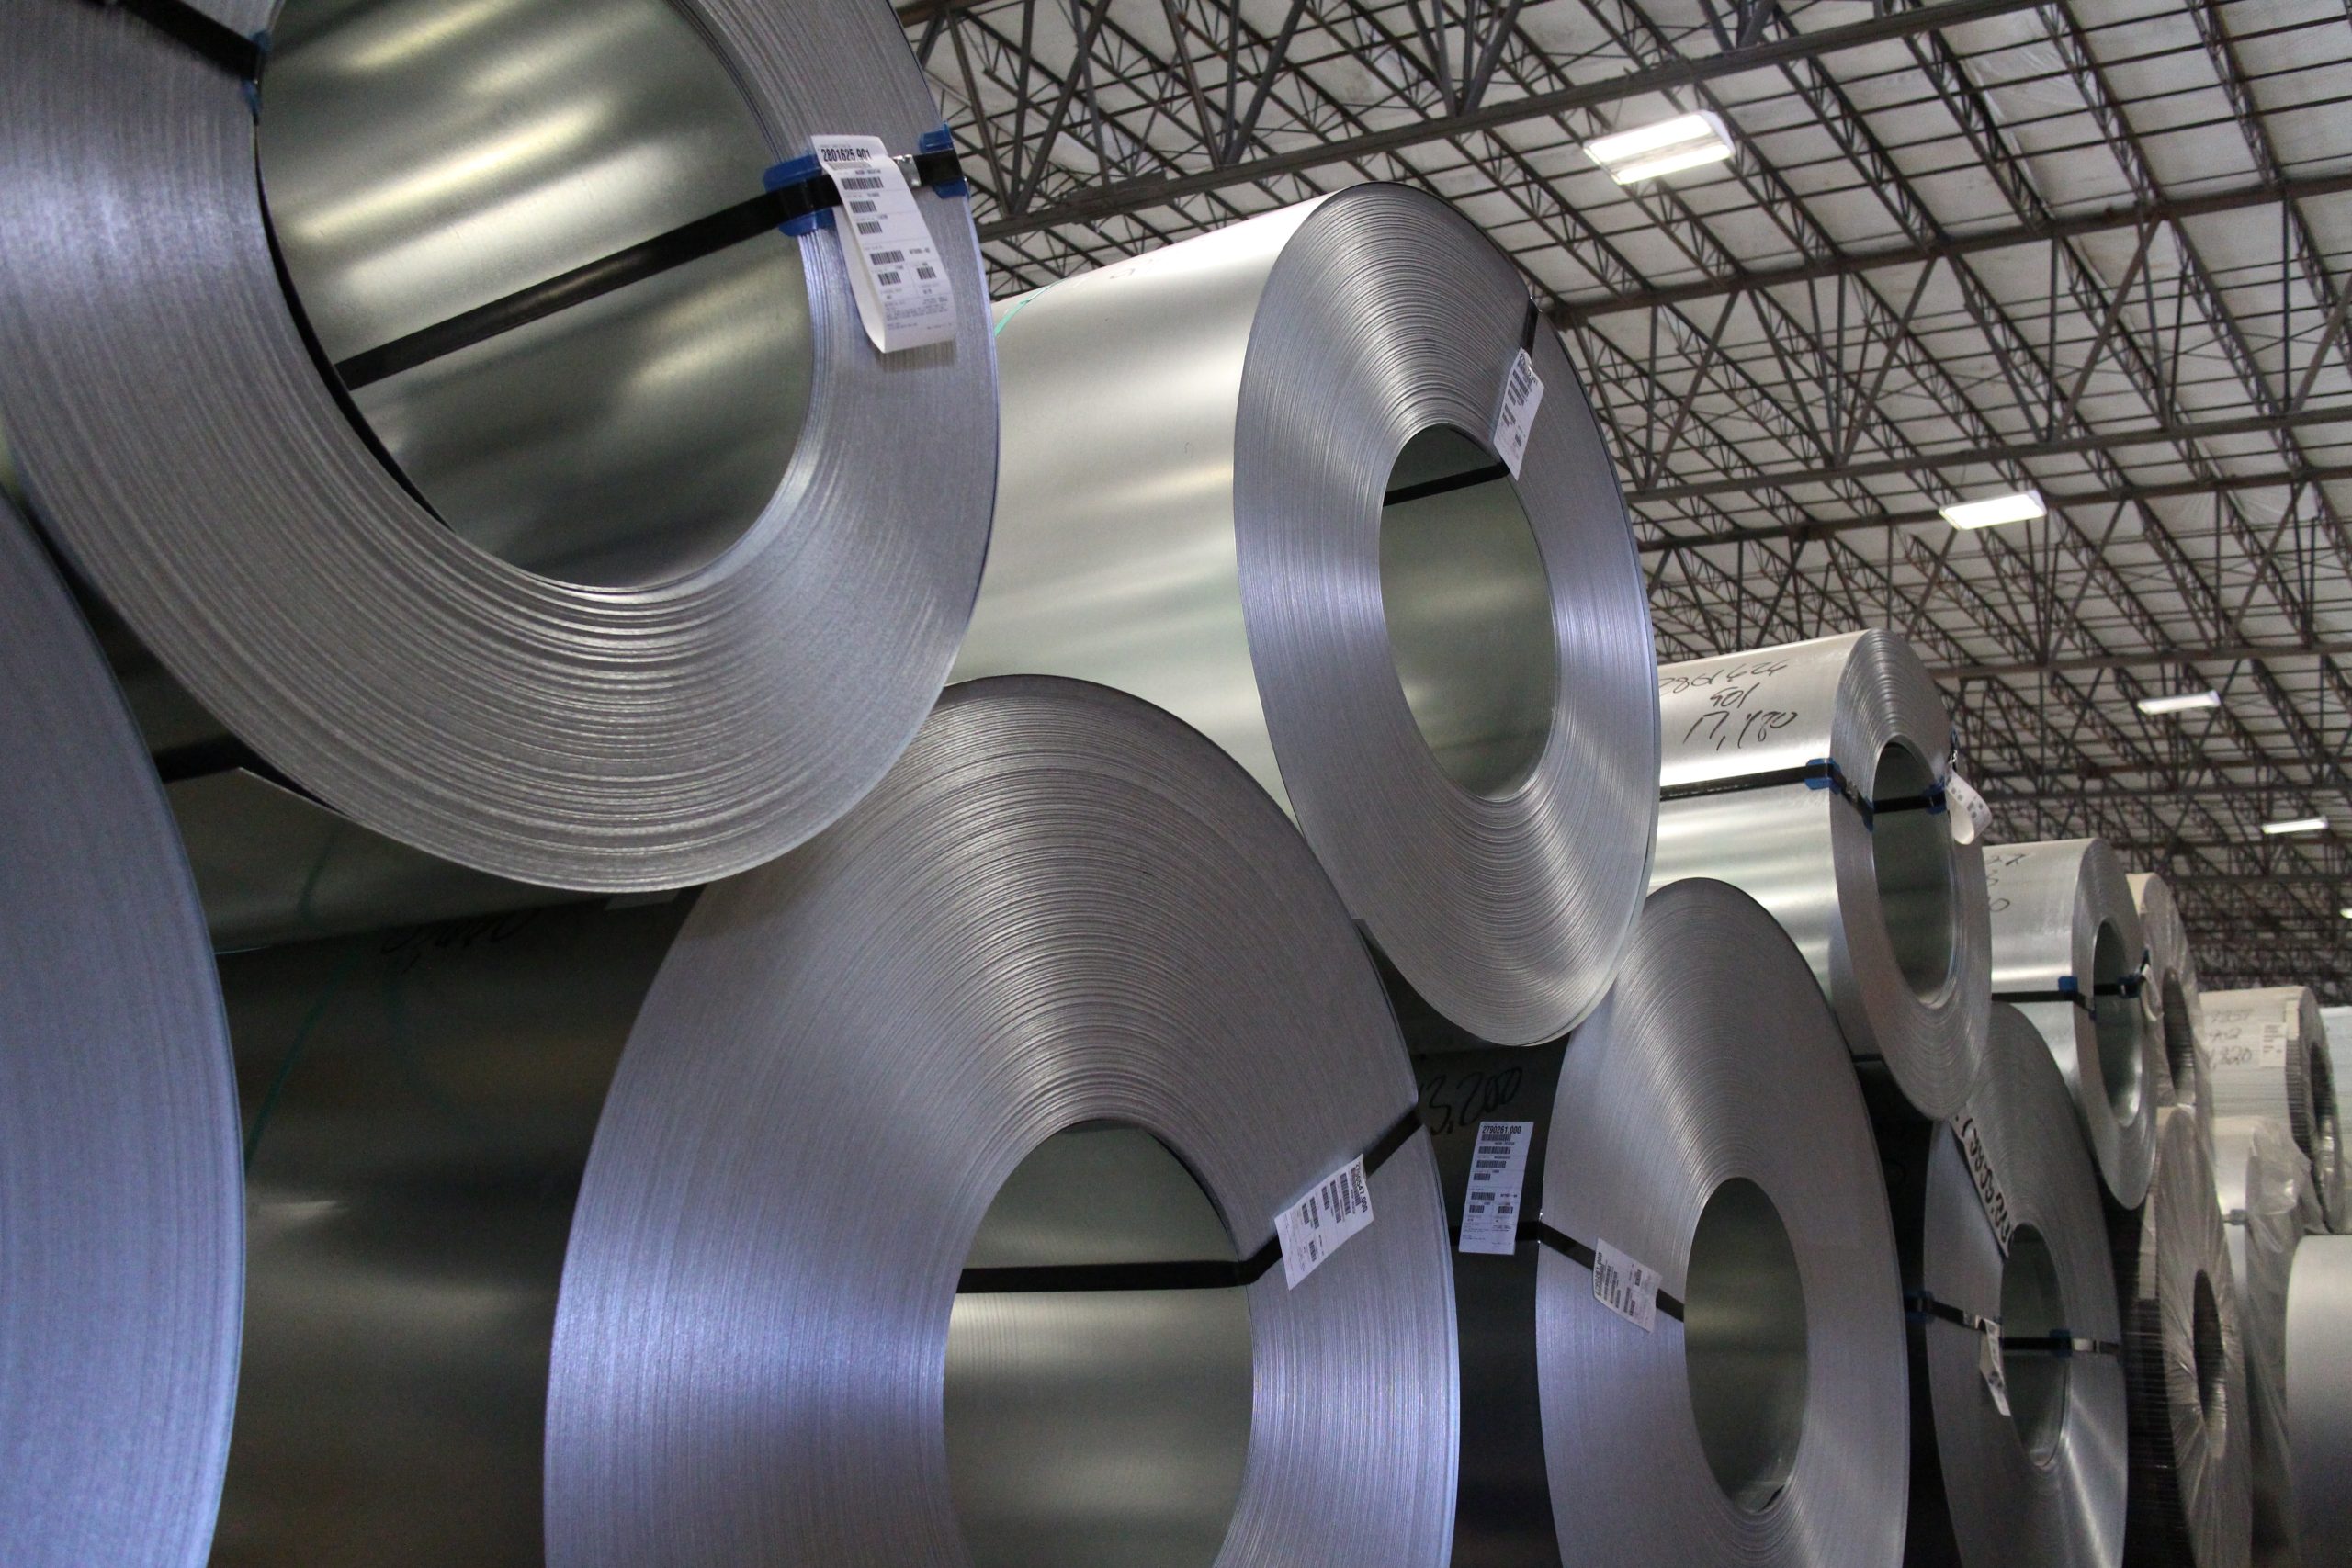
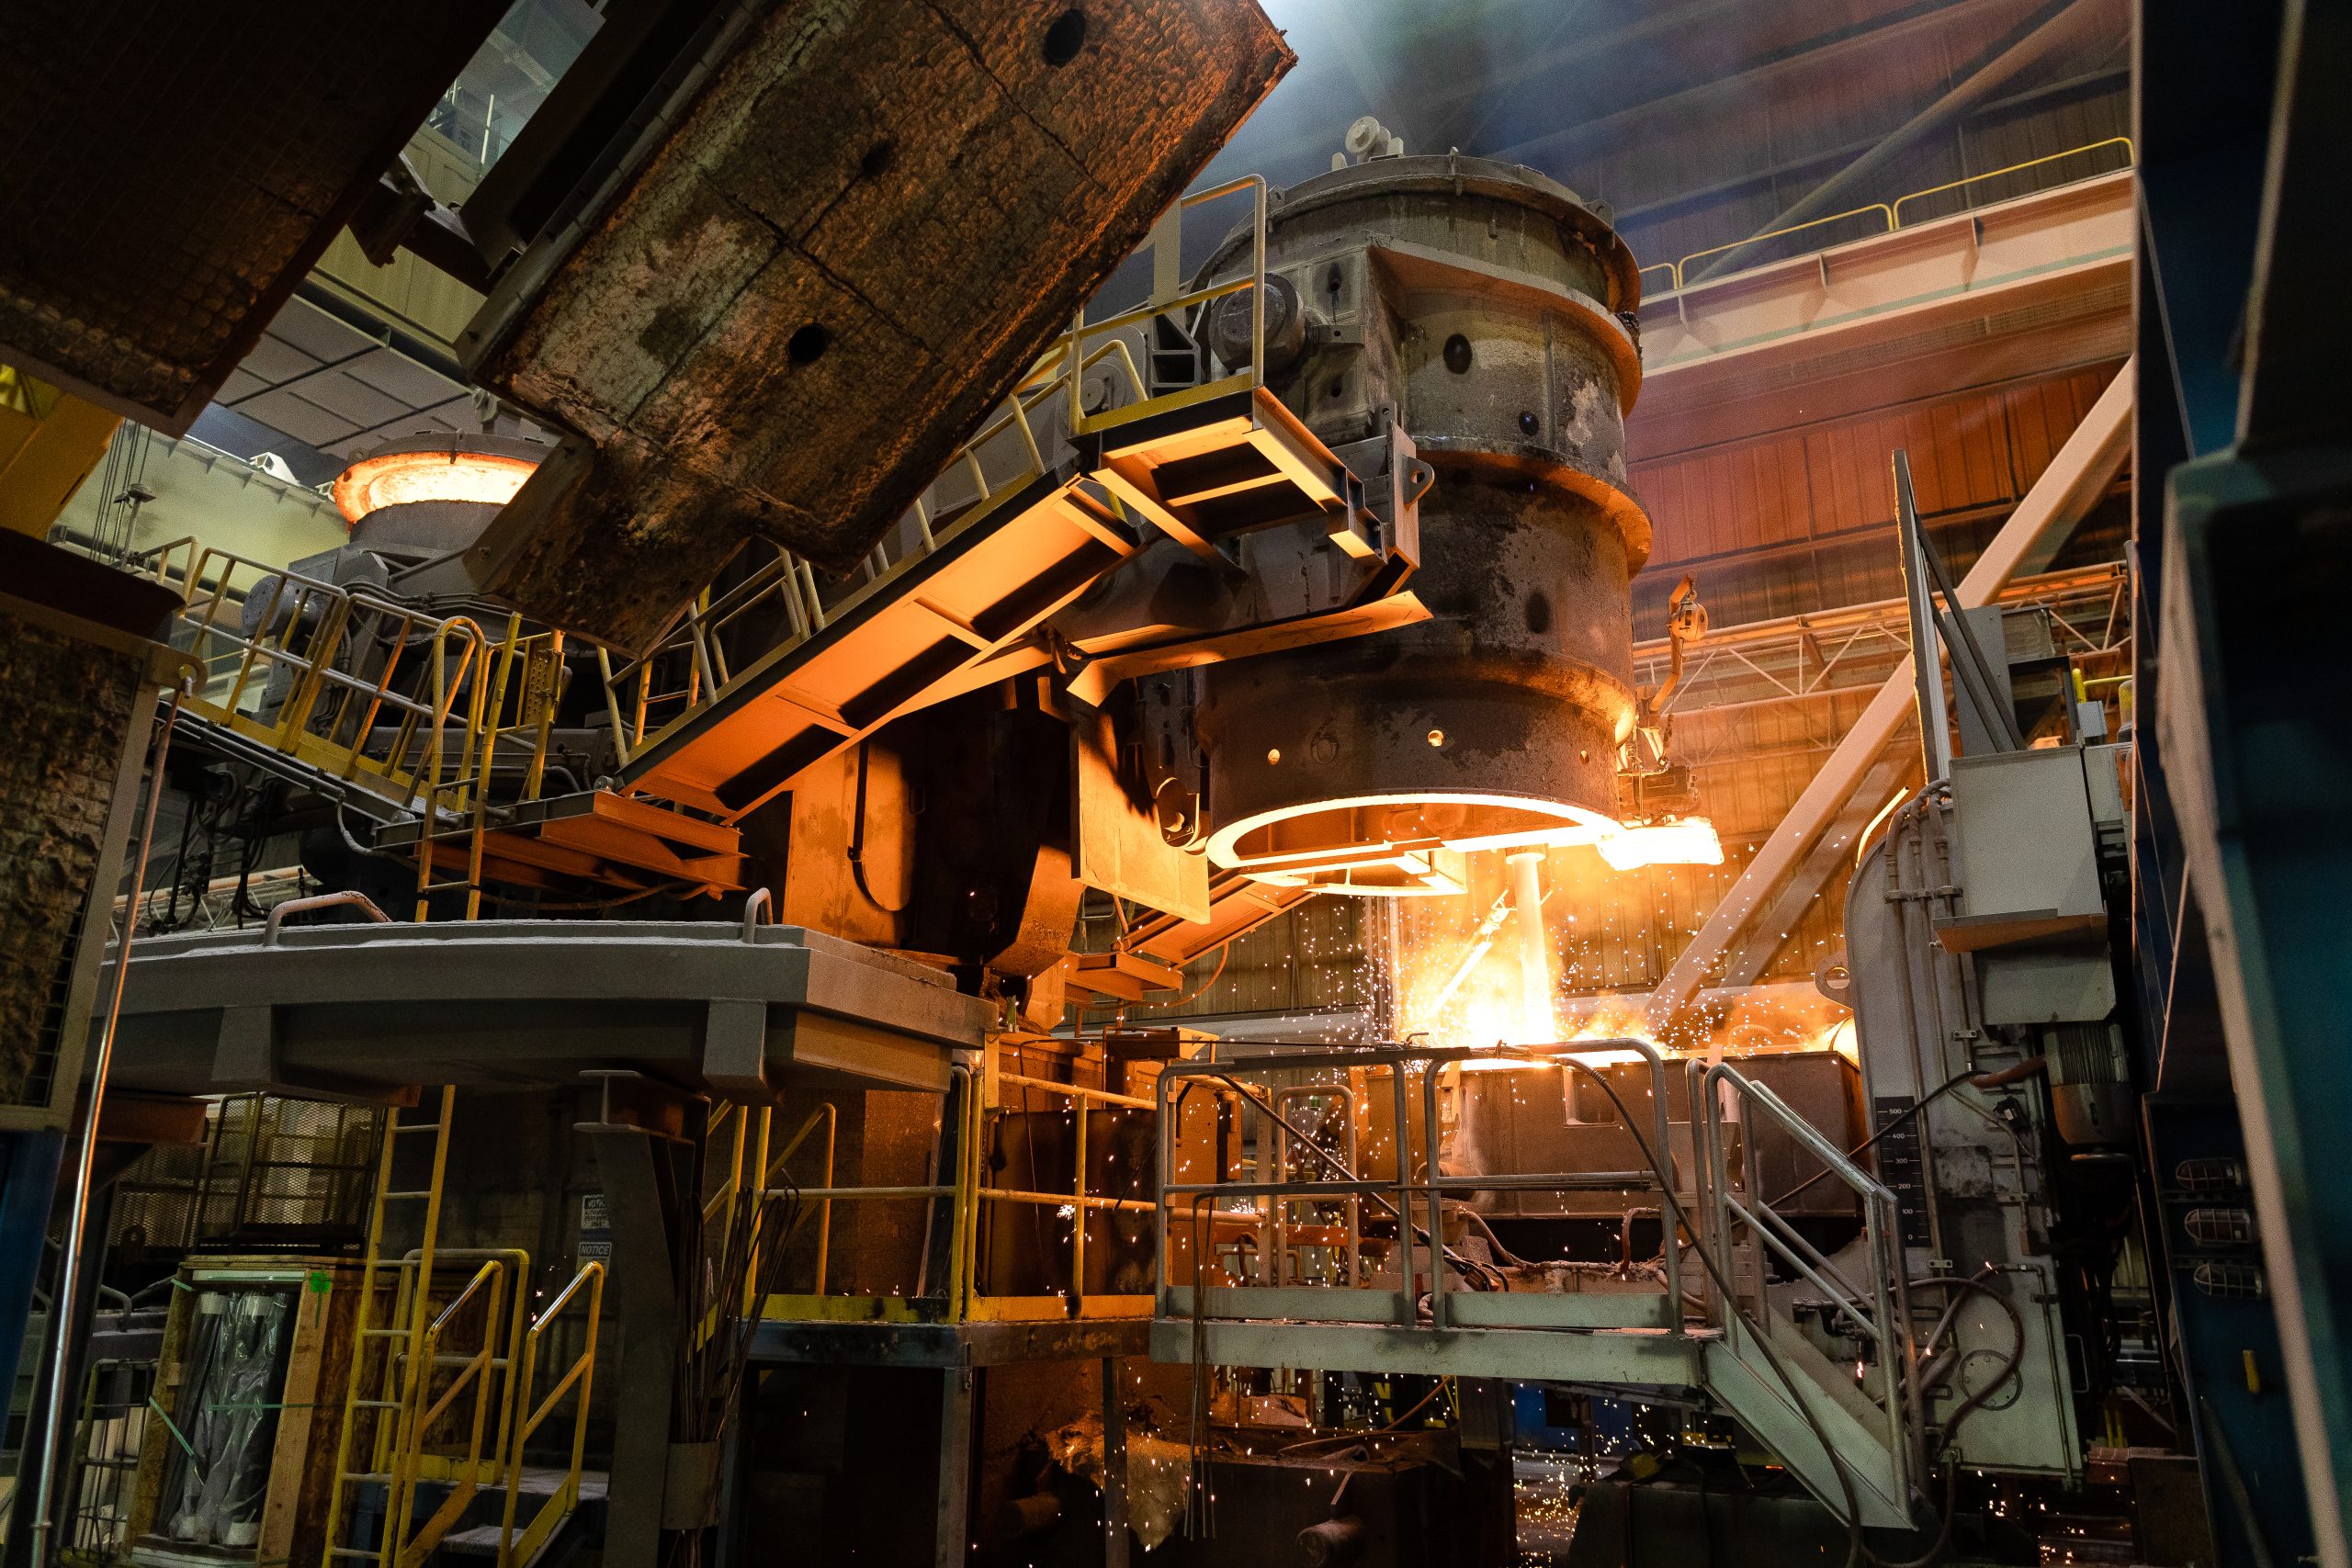

Photo Download Disclaimer
All photos herein are Nucor property or of its licensors or authors, and are proprietary document (hereinafter “the Photos”).
By taking delivery of these photos, by any means whatsoever, you agree in your name and on behalf of your company to be bound by – and comply with – the following terms and conditions:
- You are allowed to use (represent and edit) the Photos for the sole purposes of news and communication (reports and presentations), provided such use is on a non-commercial basis;
- You shall not amend, alter or otherwise modify all, or part of, the Photos;
- You shall not sell, rent, license or otherwise transfer all or part of the Photos to any third party, without prior and written consent of Nucor.
No other rights than those restrictively provided herein are granted in respect of the Photos. Nucor reserves the right to deny usage of the Photos to individual persons or entities if Nucor deems that such usage might be detrimental to its interests or image.